Sasa Bogdanovic

Data Scientist, Analytics and Data Visualization Expert

Apps Blog About Contact

Speaking at BC Tech Summit 2017

February 27, 2017
News Data science, Open data, Data visualizations, Shiny server

I’m excited and honoured to be part of the #BCTECH Summit from March 14 – 15 in Vancouver. More than 200 speakers will be sharing their knowledge and expertise on how tech is transforming the way we work, live and play. Curated sessions in a cross-sector of industries will...
Read More

English Premier League 2014-2015 - Chelsea's lead by round

July 7, 2015
News Data visualizations, Sport Stats, d3js

This chart was originally published on SportStats dot Click.

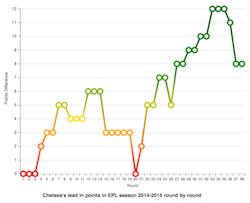
This chart highlights how comfortable Chelsea FC was in its run to English Premier League title in season 2014-2015. A couple of facts:

  • Chelsea was in lead from round 1, and the only time it wasn’t in top position...
Read More

English Premier League 2014-2015 Roundchart

July 6, 2015
News Data visualizations, Sport Stats, d3js

This chart was originally published on SportStats dot Click.

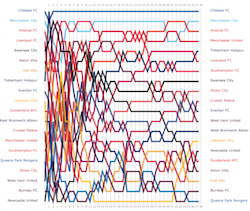
Chelsea won its 4th title in season 2014/2015. This was 23rd season since English Premier League was established. While still far away from accomplishments of Manchester United (13 titles), the way Chelsea was dominating the league this season was really...

Read More

CODE 2015 - Canadian Open Data Experience

February 20, 2015
News Data science, Open data

Our Ruby team will be taking part in CODE 2015 - The Canadian Open Data Experience. From the team list, we seem to be the only team from Kelowna registered so far.

It is a 48-hour hackathon with data nerds and innovators across Canada will compete to build the...

Read More

Data Science Specialization Top Performers

February 19, 2015
News Rstats, Data science

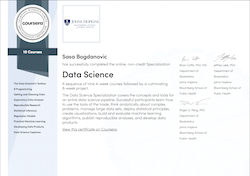
I am so honored to having been recognized as one of top performers in the largest data science program in the world put together by Johns Hopkins Univeristy and Coursera - Data Science Specialization.

As such, I was on of the folks profiled on Simply...

Read More

Google Charts bindings for Shiny example - Life expectancy data visualization

January 5, 2015
Articles Rstats, Data science, Data visualizations, Shiny server, Open data

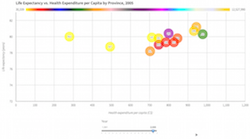
Canadian Government Open Data portal is the source of huge volumne of publicly available datasets collected by various federal and provincial departments and agencies.

In this post, I show how to acquire several datasets, clean up the data, and combine them into a single, clean dataset ready to be...

Read More

Coursera Data Science Specialization

December 22, 2014
News Rstats, Data science

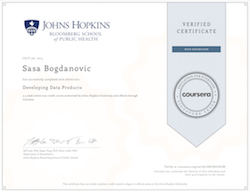
Since April 2014 I’ve been taking part in Data Science Specialization, put together by Coursera and Johns Hopkins University.

The specialization consists of nine courses that cover concepts and tools used in the entire scientific data analysis process, from asking the right questions to making statistical...

Read More

Wordiction - text prediction app

December 14, 2014
Articles Rstats, Shiny server, Data mining

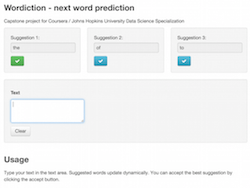
Wordiction is a text prediction app that predicts the next word to be typed in, based on previous text. It is developed in the scope of the Capstone Project for Coursera / John Hopkins Data Science Specialization.

It suggests three words most likely to be the next in the given...

Read More

World Cup 2014 - soccer team and player stats

June 19, 2014
Articles Rstats, Shiny server, Data visualizations

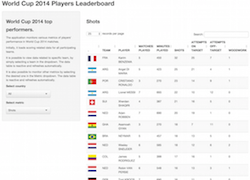
World Cup 2014 is an R application developed on Shiny server. It presents in tabular format detailed team and player stats during World Cup 2014, obtained from fifa.com website.

The app highlights detailed metrics at team and player level in the following categories:

  • Goals scored (penalties, assits,...
Read More

About me

I am Data Science consultant helping businesses make data-driven business decisions.

I combine my business acumen, rich technical experience and passion about everything data to build intuitive, easy-to-use data products, helping my clients become well-oiled, money-making machines.

I was profiled on Simply Statistic blog as on of the top performers in Johns Hopkins Unversity and Coursera Data Science Specialization.

Since 2009 I've been working in the affiliate marketing sector of iGaming industry with some of the major brands.

Read more about me.

Get social

Recent Posts

  • Speaking at BC Tech Summit 2017
  • English Premier League 2014-2015 - Chelsea's lead by round
  • English Premier League 2014-2015 Roundchart
  • CODE 2015 - Canadian Open Data Experience
  • Data Science Specialization Top Performers
  • Google Charts bindings for Shiny example - Life expectancy data visualization
  • Coursera Data Science Specialization
  • Wordiction - text prediction app
  • World Cup 2014 - soccer team and player stats

Favorite links

  • Ruby Industries Inc.
  • Izabela Bogdanovic Art
  • RStudio

© 2017 Sasa Bogdanovic. Powered by Jekyll.